Applying Observability with OpenTelemetry - Part 1 - Distributed Tracing

When I had to investigate a production issue in the past, one of the first steps was correlating log entries from multiple servers to find out full journey of a request. It was a real pain in the neck. In many instances, I had to add an additional log entry, redeploy app and check again on the next day. The full process is painful and unproductive.
To make the matter worse, most of modern software systems are no longer running in a single server, but across multiple machines, databases, SaaS, and cloud vendors. They are implemented in different programming languages, leveraging a variety of architecture patterns and communication protocols. As a result, measuring accuracy, latency, correctness and consistency of distributed systems is an intractable problem.
Observability (a term from control theory) is a quality of a software system that is implemented to generate enough data points to reason about the system during its operation. Fast high-quality feedback from production (without introducing additional code) is crucial for engineers to improve and automate highly performant and reliable systems at scale. For years, OSS libraries and SaaS vendors have already been presenting observability capabilities to export logs, metrics and traces out of software systems. In May 2019, OpenTelemetry (OTel) was announced as a CNCF sandbox project with a focus to standardise telemetry data model, architecture and implementation for observable software. At the time of writing, OTel SDKs are in beta stage and GA releases may be out soon in 2021 for major languages.
To gain a comprehensive view of OTel, I have assembled a project (called ShortenIt) in Golang to play with its key features. This custom solution is not an example of a production-ready one so please bear that in mind.
This is the first part in a series about OpenTelemetry:
- Part 1 - Distributed Tracing (this post)
- Part 2 - Logs and Metrics
- Part 3 - Cloud-native integration with AWS
Table of Contents
Explore OTel examples with ShortenIt
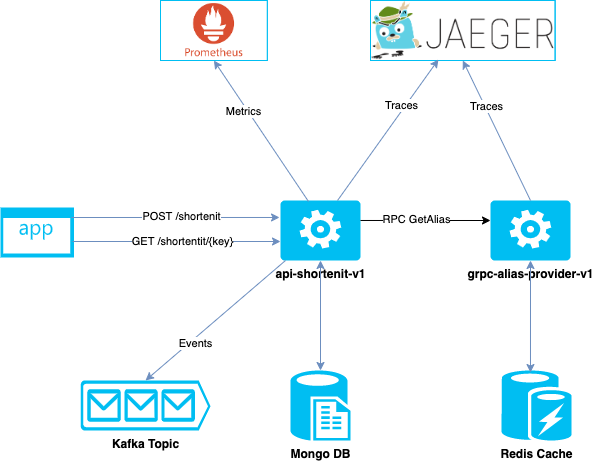
ShortenIt solution provides similar functionalities as tinyurl.com website. Basically, we can generate a short URL from a very long one. Short URLs save space for sharing, displaying or printing. In the following design, two main services api-shortenit-v1 and grpc-alias-provider-v1 are implemented with OTel to send its telemetry data (metrics, traces) to backend collectors (Prometheus and Jaeger).
Two use cases we want to add distributed trace are:
Creating a short URL via POST /shortenit
A client sends a long URL to api-shortenit-v1. This service calls grpc-alias-provider-v1 to get a short key and the URL mapping is persisted in MongoDB. If the request contains an authenticated user, we need to save the mapping to the user’s URL list as well. We need to obtain the request trace from the client to api-shortenit-v1, grpc-alias-provider-v1, MongoDB, and Redis cache (alias store).
Get the original URL for an alias via GET /shortenit/{alias}
When the client wants to get back the original URL, api-shortenit-v1 will check
the mapping in MongoDB. If found, the long URL is returned for the provided key. For the analytical purpose, the API also publishes success responses to a Kafka topic.
If you are keen on running the example locally, please follow instructions outline https://github.com/thanhnamit/shortenit
Distributed tracing in action
Now let’s have a look at an end-to-end trace of the request POST /shortenit. Client app can extract initial TraceId and SpanId in response header Traceparent. For example, 8d63ac3f01d517d71c5a803f3e37e981 is my unique TraceId. To view its trace timeline, enter the Id in Jeager at http://localhost:16686/search.
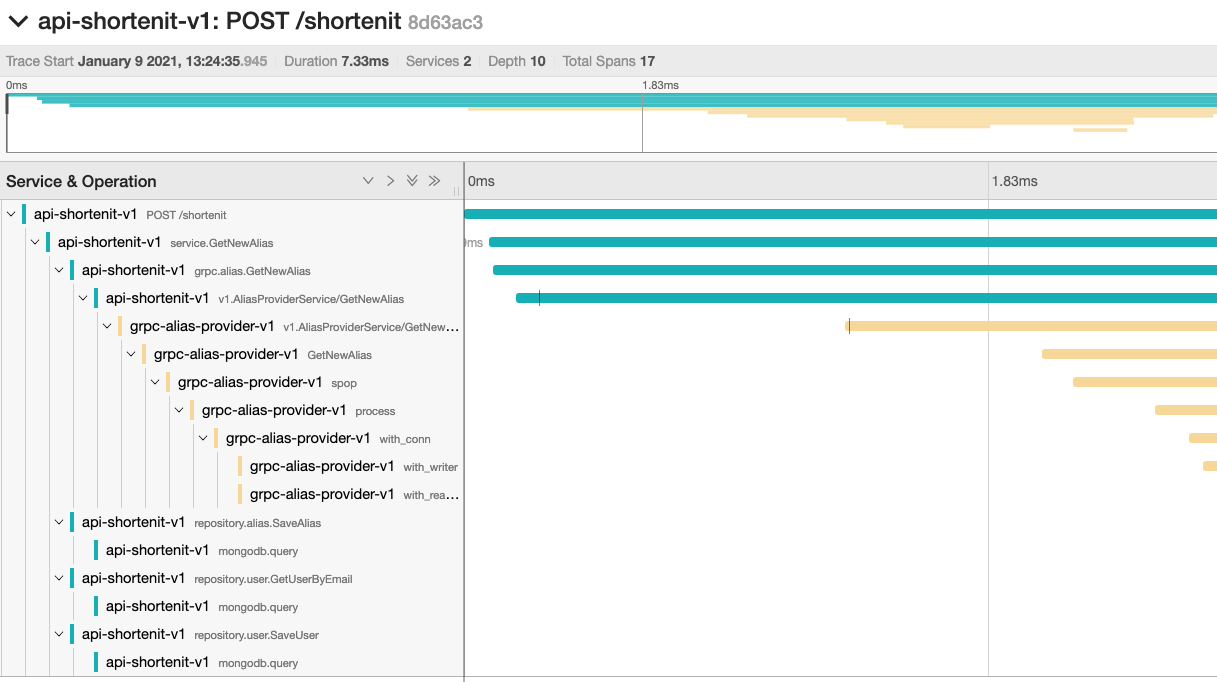
What the trace timeline telling us:
- Number of participants: 2
- The latency of request: 7.33ms
- Number of operations (spans) and execution time for each operation: 17
- Causality relationships between spans
This single end-to-end view of a request is extremely valuable for engineers to analyse and detect abnormality if service quality degraded. Additionally, each span also carries information collected at the time the operation executed, for example:
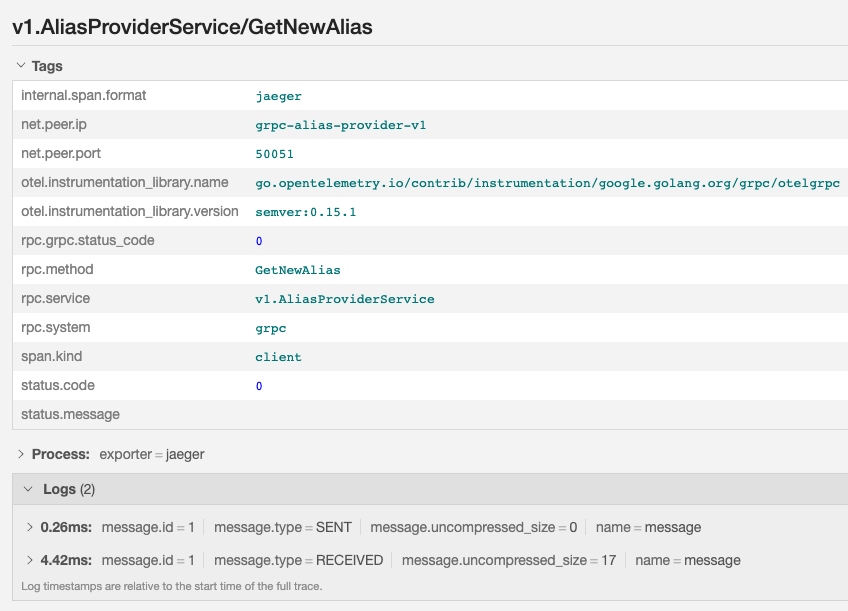
This span is instrumented by otelgrpc auto-instrumentation library for gRPC. It collects information about gRPC status code, service name & method, and host information. Span can be customised in application code to capture operation details if more visibility of the trace is required.
Let’s look at Distributed tracing from the implementation perspective. The language I used here is Golang but a similar approach should be available for other languages as they all conform to the same OTel specification.
Configuring Exporter, Tracer, Sampler and Propagator
The first step is to config necessary components for tracing. OTel Tracing API standardises the following concepts:
- Exporter: a protocol-specific, pluggable component that implements OTel’s SpanExporter interface to send telemetry data to collectors (i.e Jaeger)
- TraceProvider: creating a Tracer
- Tracer: making and linking
Spantogether - Sampler: controlling when a span is recorded
- Propagator: reading and writing context data across process boundaries
The following code configs a full pipeline backed by Jaeger’s collector endpoint normally available at http://127.0.0.1:14268/api/traces. TraceProvider, TextMapPropagator and AlwaysSample are configured and registered as global variables.
func InitTracer(serviceName string, traceCollector string) func() {
	flush, err := jaeger.InstallNewPipeline(
		jaeger.WithCollectorEndpoint(traceCollector),
		...
		jaeger.WithSDK(&sdktrace.Config{DefaultSampler: sdktrace.AlwaysSample()}),
	)
	...
	otel.SetTextMapPropagator(propagation.NewCompositeTextMapPropagator(propagation.TraceContext{}, propagation.Baggage{}))
	return flush
}
With that configuration, let’s look at several instrumentation use cases:
Custom span and in-process context passing
Tracing an individual function with blocks of logic could give us a meaningful measurement of how the main logic performs. An application should be able
to propagate in-process context in its call stack so that an existing span can be extracted for linking and a new span can be inserted. Depending on the language we choose, the Context is available explicitly (i.e Golang) or implicitly via Thread-local vars (i.e Java). In this instance, I created a custom span called service.GetNewAlias that comprises multiple child spans when the main service function calls other functions to fulfil its logic.
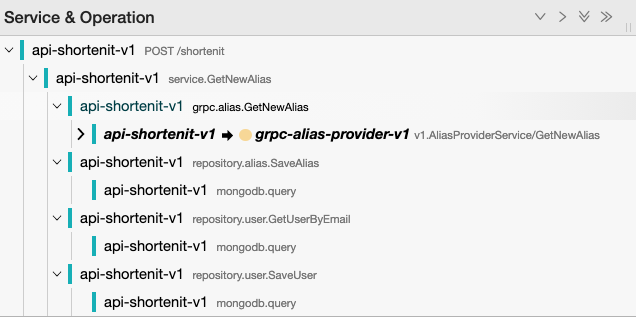
To create a new span in Go, we obtain an instance of the tracer. If the function has access to an existing context, it can pass the context to OTel trace.Start function to create a new child span.
// main function
func (d DefaultService) GetNewAlias(ctx context.Context, request core.ShortenURLRequest) (core.ShortenURLResponse, error) {
	tr := otel.Tracer(d.cfg.TracerName)
	ctx, span := tr.Start(ctx, "service.GetNewAlias")
	defer span.End()
	...

// child function
func (r *UserRepo) GetUserByEmail(ctx context.Context, email string) (*core.User, error) {
	tr := otel.Tracer(r.cfg.TracerName)
	ctx, span := tr.Start(ctx, "repository.user.GetUserByEmail")
	defer span.End()
In-process context passing is not new as it has been implemented in many frameworks. Inter-process context passing, however, requires a different strategy for interoperability.
Tracing remote calls and propagating inter-process context
In a lot of situations, our service will need to call an upstream service, hence this is an ideal point for instrumentation. In Shortenit case, api-shortenit-v1 calls grpc-alias-provider-v1 using gRPC protocol. As you might guess, there will be two spans created, one on the caller’s side and one on the receiver’s side.
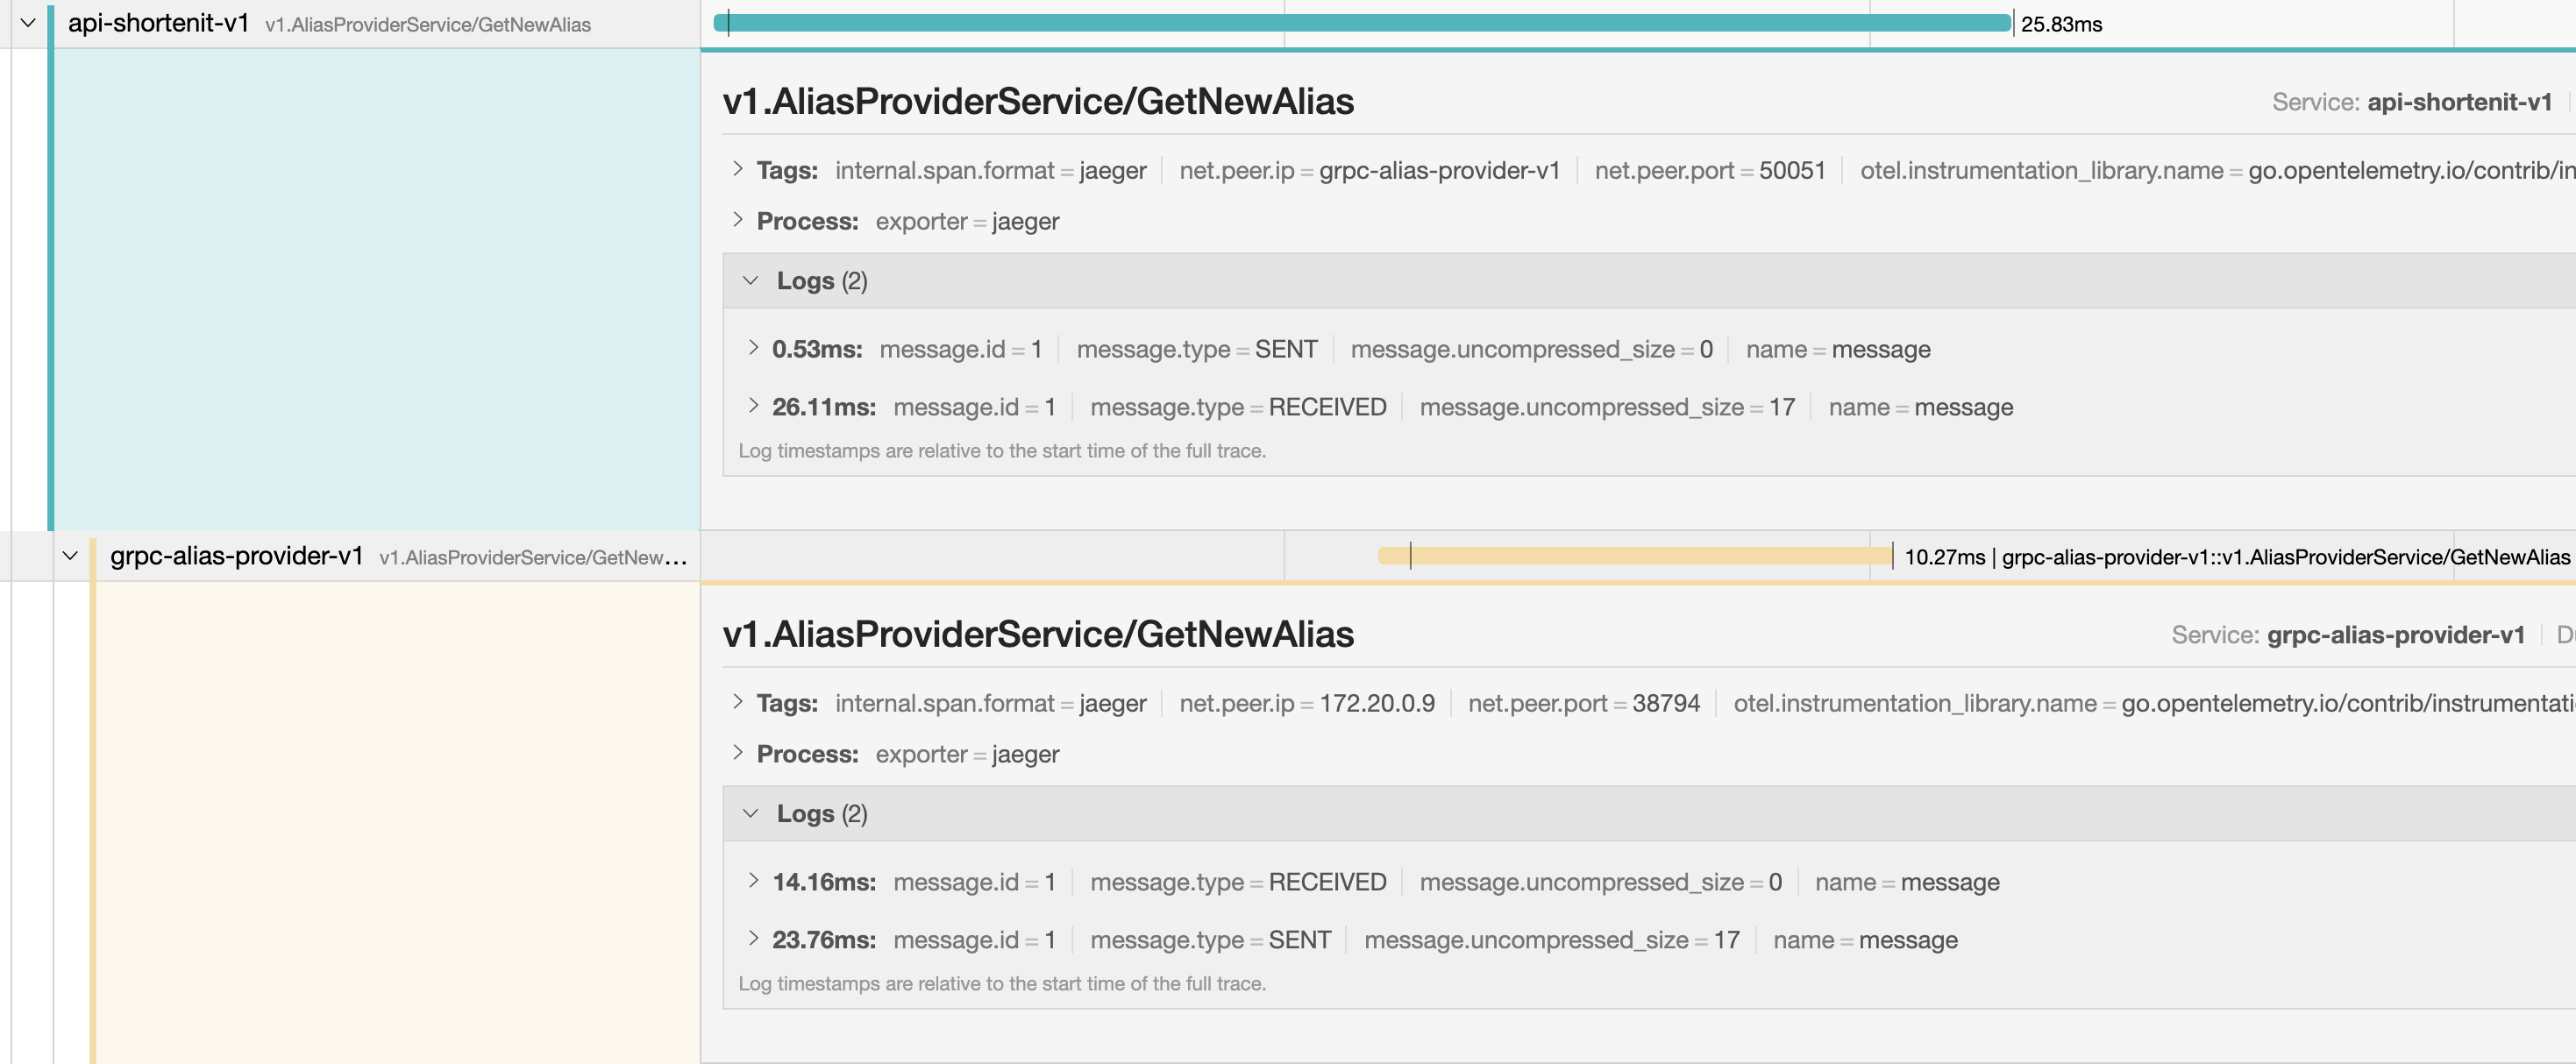
As above, all we need is to add dependencies and configure on client and server
go get -u go.opentelemetry.io/contrib/instrumentation/google.golang.org/grpc/otelgrpc@v0.15.0
gRPC client needs to be configured with an Interceptor
func NewAliasClient(cfg *config.Config) *AliasClient {
	conn, err := grpc.DialContext(context.Background(), cfg.AliasCon, grpc.WithInsecure(), grpc.WithBlock(), grpc.WithUnaryInterceptor(otelgrpc.UnaryClientInterceptor()))
    //...
}
An inceptor on the server-side
s := grpc.NewServer(
    grpc.UnaryInterceptor(otelgrpc.UnaryServerInterceptor()),
)
It sounds like magic but if we look at the Interceptor code all it does is interacting with OTel SDK’s propagators to inject metadata to an outgoing request and extract that from an incoming request. Currently, OTel SDKs bundled with W3C Trace Context implementation as default.
Instrumenting HTTP listener
Instrumenting at the listener level provides valuable information about how a client interacts with a REST service. We can record HTTP related attributes in Span tags (method, path, user_agent, status code…).
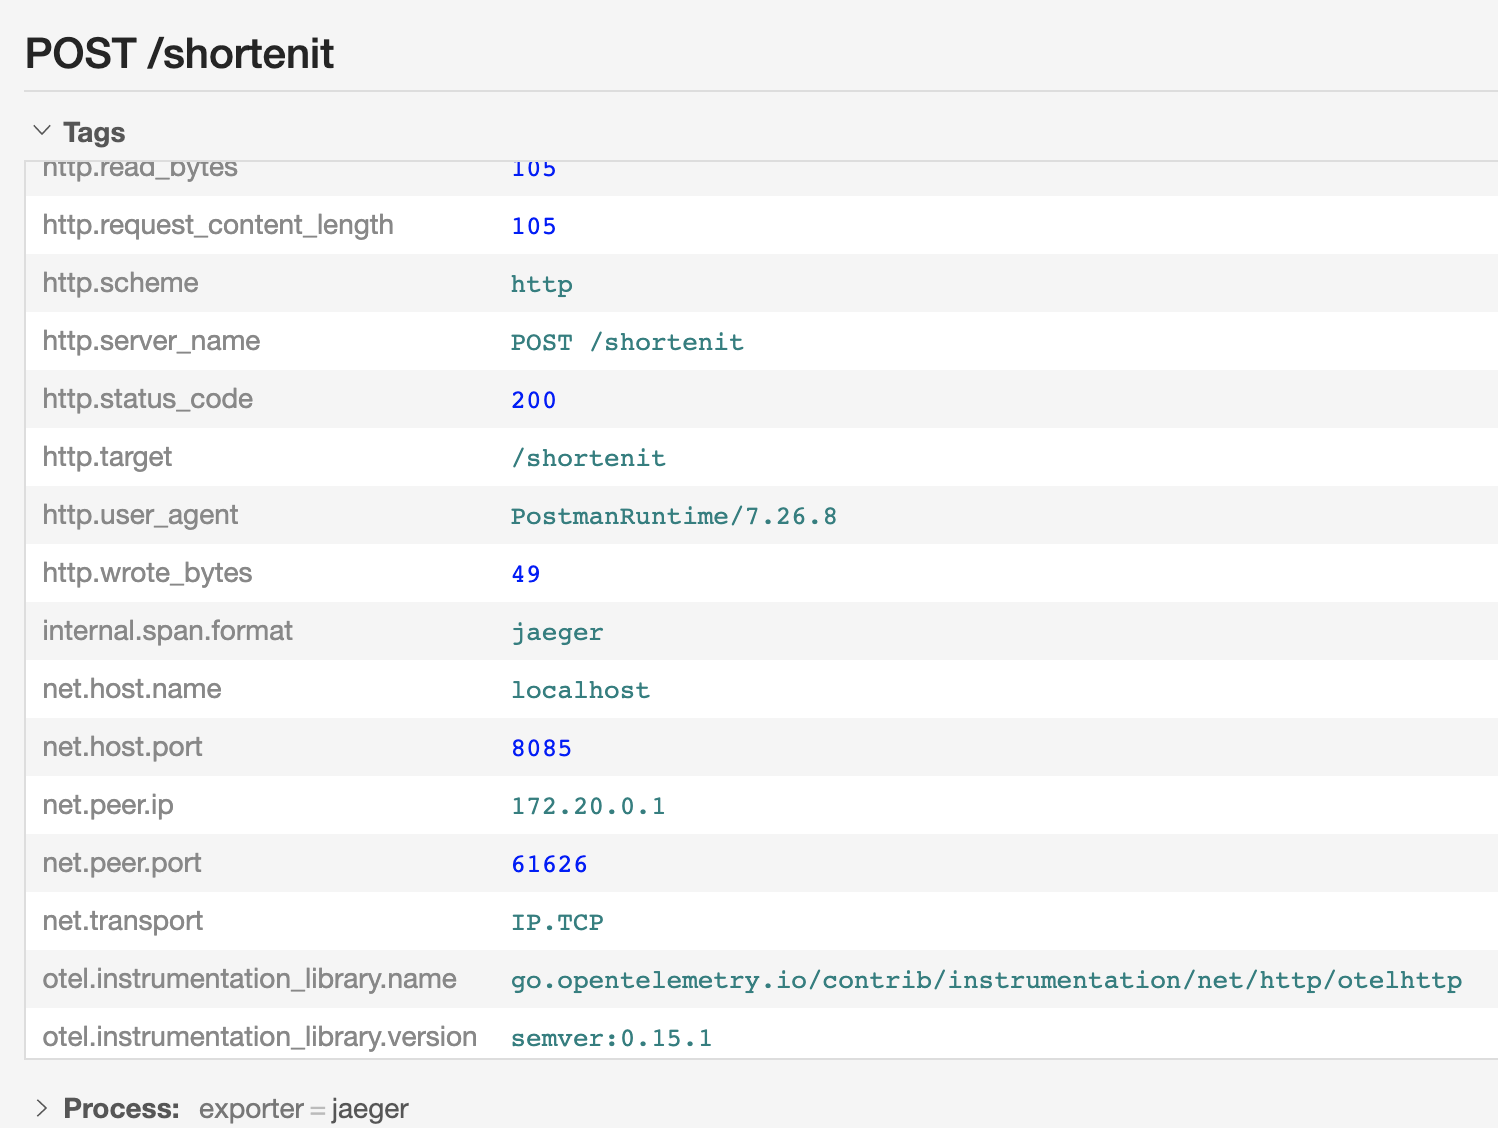
The instrumentation library is otelhttp, not part of OTel spec but provided by community or vendor. We need to add this dependency and register it as middleware in HTTP pipeline.
go get -u go.opentelemetry.io/contrib/instrumentation/net/http/otelhttp@v0.15.0
func NewGlobalHandler(handler http.Handler, operation string) func(w http.ResponseWriter, r *http.Request) {
	return toHandlerFunc(withCORS(withAPIKey(otelhttp.NewHandler(handler, operation))))
}
Instrumenting storage clients
As a lot of performance issues are database-related, instrumenting database interaction is a crucial part to analyse and troubleshoot the issues. Commercial and OSS database vendors start adopting OTel instrumentation by providing their version of the library. The span below, created by otelmongo, exposes details about the query execution and database instance that our API interacts with.
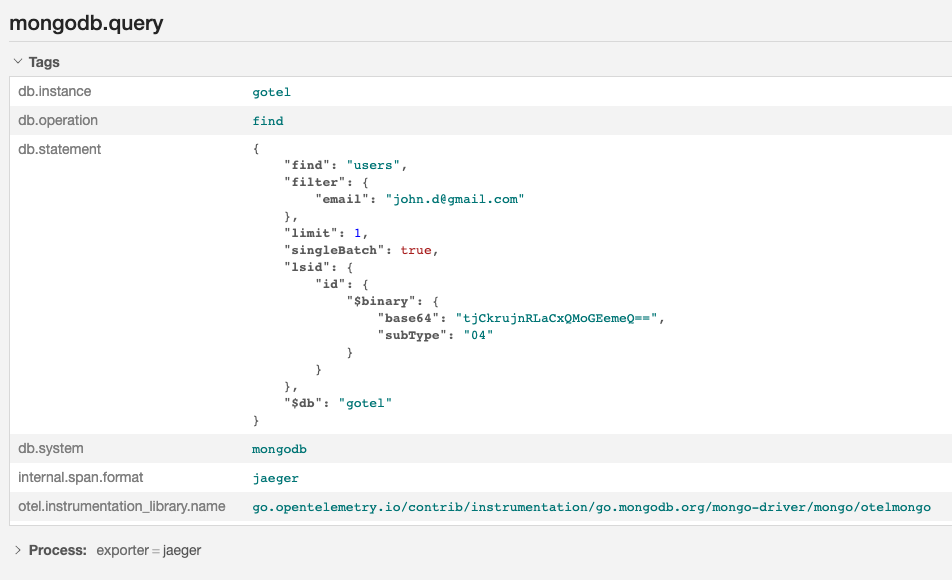
go get -u go.opentelemetry.io/contrib/instrumentation/go.mongodb.org/mongo-driver/mongo/otelmongo
Setting up new mongo connection with an additional monitor
opts := options.Client()
opts.Monitor = otelmongo.NewMonitor(cfg.AppName)
opts.ApplyURI(cfg.MongoCon)
db, err := mongo.NewClient(opts)
Instrumentation for messaging
Instrumenting for messaging or asynchronous calls is not always easy as it involves a message queue/topic in between and context has to be passed together with messages (requires a change in message structures). Shopify’s engineering team has contributed otelsarama library to support Kafka client/server instrumentation.
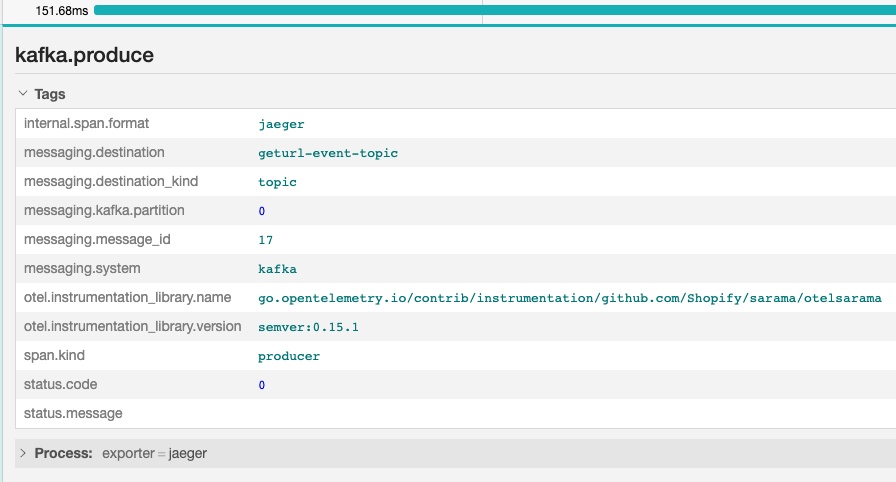
go get -u "go.opentelemetry.io/contrib/instrumentation/github.com/Shopify/sarama/otelsarama"
Configuration to Sarama’s producer:
...
producer, err := sarama.NewAsyncProducer(brokerList, cfg)
...
producer = otelsarama.WrapAsyncProducer(cfg, producer)
...
With that we need to explicitly inject the metadata using the configured propagator before sending a message to a topic:
...
otel.GetTextMapPropagator().Inject(ctx, otelsarama.NewProducerMessageCarrier(&msg))
ep.producer.Input() <- &msg
...
Web and mobile instrumentation
Most of the frontend apps today interact with REST api via HTTP, so this scenario is identical to the remote call instrumentation. However, since frontend apps are deployed closer to end-user, a trust layer needs to be established to make sure that tracing data is valid and correctly adjusted before assembling traces.
Summary
Distributed tracing is the first pillar of Observability, its main goal is to enable engineers to understand and debug programmatic failures in a distributed environment. In the next post, we will look at how OTel handles logs and metrics. Stay tuned!