Applying Observability with OpenTelemetry - Part 2 - Metrics and Logs

This is the second part in a series about OpenTelemetry:
- Part 1 - Distributed Tracing
- Part 2 - Metrics and Logs (this post)
- Part 3 - Cloud-native integration with AWS
Metrics
Telemetry has long been used in industries to monitor and predict potential issues. For example, most cars today have an onboard diagnostic system (OBD) that can be connected with a scanner to read its trouble code. A solar monitoring system can report metrics about energy consumption, production, grid export and import. In the software world, metric events are viable signals for monitoring overall system health. Mission-critical systems are designed to continuously emit gauges, counter and aggregated metrics in a time-series format so that they can be indexed, statistically transformed, correlated and visualised. Engineers have utilised various tools to monitor software performance signals such as latency, errors, traffic, saturations. These tools are specifically designed for each layer of abstraction:
- Infrastructure: netstat, iostat, vmstat, sysstat, cAdvisor, kube-state-metrics, node-exporter…
- Application: JMX/micrometer, StatsD, Prometheus, Opencensus…
- Platform: Datadogs, Splunk, Newrelics…
This complexity in the tooling landscape poses challenges for businesses to build and operate their platform in a unified way. As a CNCF project, OTel’s main goal is standardising metric types, telemetry pipeline architecture and providing a vendor-agnostic OLTP protocol for the transmission of telemetry data over the network. While still in beta, the Metrics API and Go SDK is ready for some certain experiments, we will tap into the key concepts by examples.
Table of Contents
OpenTelemetry Metric architecture
Similar to Tracing SDK, the architecture for metrics processing consists of two major components:
- Metrics API is the user-facing API that captures runtime measurements. Applications will pass raw measurements with metadata to the unified interface.
- Metrics SDK is the actual implementation that processes telemetry data through a composable pipeline of accumulators, processors and exporters. A default SDK implementation is provided for each language.
The journey of a metric event is illustrated through the diagram below:
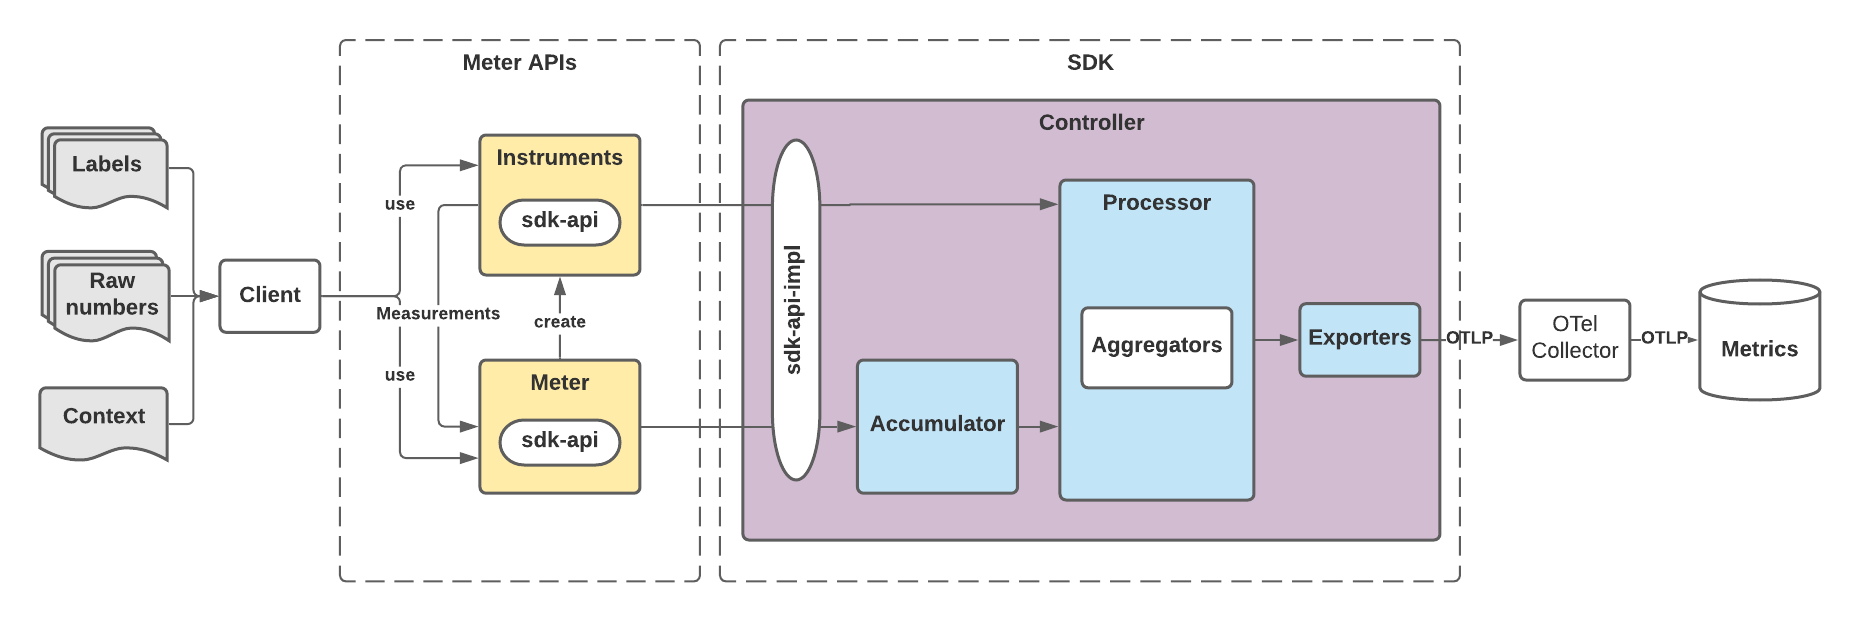
- The client obtains a global Meter instance from the SDK. For each kind of measurement, the client creates an appropriate Metric instrument from the Meter.
- The client provides the metric instrument with raw measurement, optional execution context and labels.
- The instrument invokes SDK implementation api and passes through the metric event.
- Depending on the measurement semantic (see below), if batching is required, the Accumulator batches the metrics to optimise performance.
- The processor picks a suitable aggregator to perform aggregation logic on the metric events.
- The Controller manages the how and when the metric collection happens via collection mode (either push or pull), collection checkpoints and the timer.
- Exporters export outcome to storage backend or scraper via a configured metric protocol like OLTP.
In the
ShortenIt example, we will explore how OTel exports simple metrics to Prometheus backend and view it via Grafana. The code below starts a metric server and initiate an HTTP endpoint /metrics for Prometheus scraper. It is also configured with auto-instrumentation for application runtime and host, this is very handy if we don’t want to write code to collect those metrics from scratch.
func InitMeter() {
	exporter, err := prometheus.InstallNewPipeline(
		prometheus.Config{
			DefaultHistogramBoundaries: []float64{8000.00, 10000.00, 13000.00, 16000.00},
		},
	)
	if err != nil {
		log.Fatalf("Failed to init prometheus exporter: %v", err)
	}
	http.HandleFunc("/metrics", exporter.ServeHTTP)
	go func() {
		if err = runtime.Start(runtime.WithMinimumReadMemStatsInterval(time.Second)); err != nil {
			log.Fatalf("Failed to init runtime instrumentation: %v", err)
		}
		if err = host.Start(); err != nil {
			log.Fatalf("Failed to init host instrumentation: %v", err)
		}
		_ = http.ListenAndServe(":2222", nil)
		fmt.Println("Metric server running on :2222")
	}()
}
Metric event semantics
For the SDK to apply proper processing logic to each type of measurement, the metric event must carry its own semantics. OTel defines three key semantic groups:
- Synchronicity: synch - a metric event is collected immediately (i.e latency) or async - the event is collected later in a separate process (i.e mem stats).
- Measurement Style: adding - new value is added to previous metric value (i.e sum) or grouping - collect individual values (i.e latency).
- Monotonicity: monotonic - positive increase only (i.e number of 200 OK) or non-monotonic - both positive and negative increase (i.e queue depth).
For each measurement, the meter provides a corresponding instrument. Let’s loop through each of them with some examples.
Counter
To be used when it is meaningful to record the sum of a metric at a point in time. In the case of counting total bytes processed by an endpoint, this instrument has the following characteristics:
- Synchronous: the size of a request is captured immediately during execution.
- Adding: only a single value makes sense.
- Monotonic: the total of bytes is only increasing.
func recordRequestSize(meter metric.Meter, r *http.Request, req core.ShortenURLRequest, label *label.KeyValue) {
	counter := metric.Must(meter).NewInt64Counter("api-shortenit-v1.create-alias.request-size.total")
	counter.Add(r.Context(), req.Size(), *label)
}
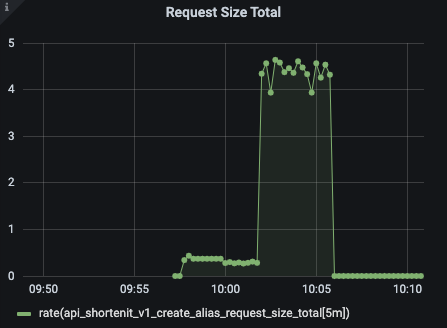
For exporting, OTel metric values need to be converted to a vendor’s format. For example, Prometheus only accepts certain metric types such as Counter, Gauge, Histogram and Summary. This graph shows the rate of increment of the total request size processed by the API.
UpDownCounter
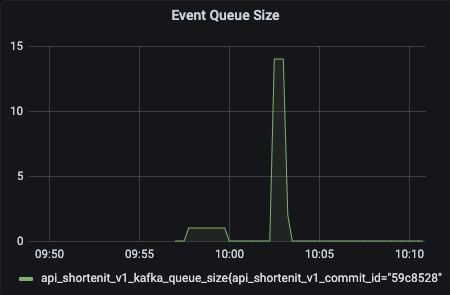
To illustrate this, we instrument Kafka queue size whenever events are published and consumed.
- Synchronous: increments are captured immediately.
- Adding: aggregate a sum.
- Non-monotonic: the sum can go up or down.
// on producer side
func recordEventPublished(meter metric.Meter, ctx context.Context, l *label.KeyValue) {
	upDownCounter := metric.Must(meter).NewInt64UpDownCounter("api-shortenit-v1.kafka-queue-size")
	upDownCounter.Add(ctx, 1, *l)
}

// on consumer side
func recordEventConsumed(meter metric.Meter, ctx context.Context, l *label.KeyValue) {
	upDownCounter := metric.Must(meter).NewInt64UpDownCounter("api-shortenit-v1.kafka-queue-size")
	upDownCounter.Add(ctx, -1, *l)
}
Output graph in Grafana to show the queue size
ValueRecorder
The common use of the ValueRecorder instrument is to record every single latency measurement. It is useful to gain a statistical view of request latency such as mean, median or percentile. Characteristics of a ValueRecorder are:
- Synchronous: latency is captured for every execution path.
- Grouping: all values are recorded rather than added to a sum.
- Non-monotonic: latency value can increase or decrease.
Manually recording latency at the server side can be done in middleware as in the example below
func latencyRecorder(next http.Handler, operation string) func(w http.ResponseWriter, r *http.Request) {
	return func(w http.ResponseWriter, r *http.Request) {
		meter := otel.Meter("api-shortenit-v1")
		requestStartTime := time.Now()

		path := fmt.Sprintf("http://%s%s", r.Host, r.URL.Path)
		ctx := context.WithValue(r.Context(), ContextKey(CtxBasePath), path)
		next.ServeHTTP(w, r.WithContext(ctx))

		elapsedTime := time.Since(requestStartTime).Microseconds()
		recorder := metric.Must(meter).NewInt64ValueRecorder("api-shortenit-v1.latency")

		labels := []label.KeyValue{label.String("operation", operation), label.String("http-method", r.Method)}
		recorder.Record(r.Context(), elapsedTime, labels...)
	}
}
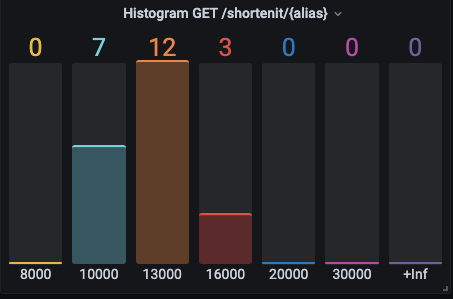
Exported metrics are converted into Prometheus histogram and put into the predefined buckets, for example:
api_shortenit_v1_latency_bucket{http_method="GET",operation="GET /shortenit/{alias}",le="8000"} 0
api_shortenit_v1_latency_bucket{http_method="GET",operation="GET /shortenit/{alias}",le="10000"} 7
api_shortenit_v1_latency_bucket{http_method="GET",operation="GET /shortenit/{alias}",le="13000"} 19
api_shortenit_v1_latency_bucket{http_method="GET",operation="GET /shortenit/{alias}",le="16000"} 22
api_shortenit_v1_latency_bucket{http_method="GET",operation="GET /shortenit/{alias}",le="20000"} 22
api_shortenit_v1_latency_bucket{http_method="GET",operation="GET /shortenit/{alias}",le="30000"} 22
api_shortenit_v1_latency_bucket{http_method="GET",operation="GET /shortenit/{alias}",le="+Inf"} 22
api_shortenit_v1_latency_sum{http_method="GET",operation="GET /shortenit/{alias}"} 245839
api_shortenit_v1_latency_count{http_method="GET",operation="GET /shortenit/{alias}"} 22
When plotting a graph on Grafana we have
SumObserver
This instrument is a proper choice for expensive measurements where the calculation for each request is not so useful and the request’s context is not important.
- Asynchronous: the SDK collects metric data once per collection interval without the request context.
- Adding: collected values are added to a sum.
- Monotonic: the sum is only increasing.
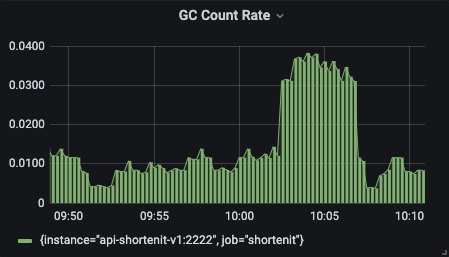
An example of this instrument is used to record the number of completed GC cycles in Go, which can be found in the contrib package https://pkg.go.dev/go.opentelemetry.io/contrib/instrumentation/runtime.
The output from the metric endpoint:
# TYPE runtime_go_gc_count counter
runtime_go_gc_count 463
As it is monotonic and adding, we can graph an increased rate:
UpDownSumObserver
Similar to UpDownCounter but this instrument is asynchronous and suitable for capturing expensive metrics or metrics that change too frequently.
https://pkg.go.dev/go.opentelemetry.io/contrib/instrumentation/runtime contains several examples of this instrument to measure:
- Bytes of allocated heap objects.
- The number of allocated heap objects.
- Bytes of heap memory obtained from the OS.
ValueObserver
This is an asynchronous version of the ValueRecorder which collects grouping measurements non-monotonically and produce a distribution of recorded values (i.e CPU temperature).
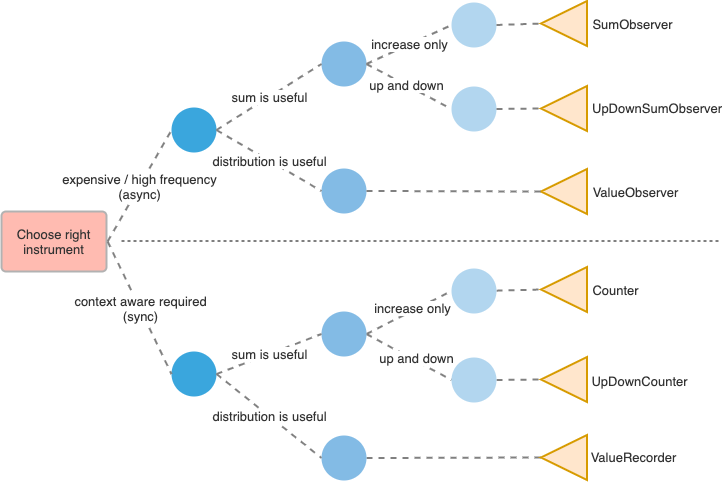
How to pick the right instrument
Using the right instrument would require library users to have some understanding of the semantics. Instead of strolling through the spec, I have created this decision tree to help to make such decisions easier.
A quick note about cardinality
On a retrospective post about Observability, Charity Major stressed the importance of high-cardinality data for observable systems. Typical metrics-based tools that were designed for monolithic systems only provide aggregated low-cardinality dimensions which are not useful for debugging purpose in the context of distributed systems. To help uncover hypotheses and pin down exactly the bad code block, high-cardinality data request ID, customer ID or event ID should be available.
OTel library plans to support both cumulative and stateless exporters to output high-cardinality events to a downstream collector or metric backend. This has been discussed with details in a community talk by Josh MacDonald.
Logs
At the current stage, OTel does not provide a new Logging API. It relies on current well-known logging libraries to supply log events in existing formats. Log entries are forwarded to an OTel collector which performs transformation to a log data model before exporting to storage backends. The log data model hence is defined to share a common understanding of what log entries should look like, including the key information for log correlation such as time of execution, execution context and resource context. We will explore this area more in the next post.
Summary
In the first two posts, we have touched on each individual component of OpenTelemetry. Each component deals with a specific concern in observability space. The most important thing, however, is how to leverage these components to gain a more comprehensive view of a distributed system running in production. In the next post, I will attempt to put these concepts together by combining traces, metrics and logs. I also will discuss possible deployment topologies for microservices architecture within a cloud-native platform such as AWS. Stay tuned!